Financial Performance: Strengths and Weakness Analysis
Financial analysis is the process of evaluating an organization’s financial performance and health. It involves examining financial statements, such as the income statement, balance sheet, and cash flow statement, to understand how the organization generates and uses its funds.
The goal of financial analysis is to identify areas of financial strength and weakness within an organization, as well as to identify potential opportunities for growth and improvement. Financial analysis can help organizations make informed decisions about investments, acquisitions, mergers, and other financial activities.
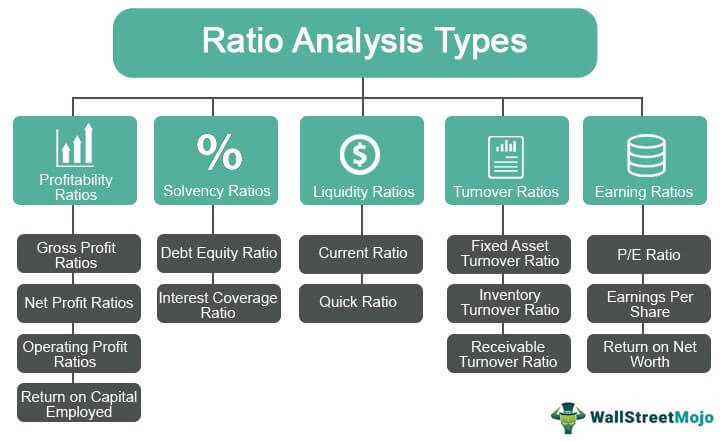
Some common financial analysis techniques include ratio analysis, trend analysis, and cash flow analysis. These methods help to assess an organization’s liquidity, profitability, efficiency, solvency, and overall financial stability.
Financial analysis is important for many stakeholders, including investors, creditors, lenders, and management. By understanding an organization’s financial performance, these groups can make informed decisions about their investments, loans, and other financial commitments.
Overall, financial analysis is a critical tool for understanding an organization’s financial health and making informed financial decisions.
Common Financial Ratios with Formula

Most commonly used financial ratios in financial analysis with their formulas:
- Liquidity Ratios:
a. Current Ratio: This ratio measures an organization’s ability to pay its short-term debts. The formula for the current ratio is:
Current Ratio = Current Assets / Current Liabilities
b. Quick Ratio: This ratio measures an organization’s ability to pay its short-term debts using its most liquid assets. The formula for the quick ratio is:
Quick Ratio = (Current Assets – Inventory) / Current Liabilities
c. Cash Ratio: This ratio measures an organization’s ability to pay its short-term debts using its cash and cash equivalents. The formula for the cash ratio is:
Cash Ratio = (Cash and Cash Equivalents) / Current Liabilities
- Profitability Ratios:
a. Gross Profit Margin: This ratio measures the percentage of revenue that remains after deducting the cost of goods sold. The formula for the gross profit margin is:
Gross Profit Margin = (Revenue – Cost of Goods Sold) / Revenue
b. Net Profit Margin: This ratio measures the percentage of revenue that remains after deducting all expenses. The formula for the net profit margin is:
Net Profit Margin = (Net Income / Revenue) x 100
c. Return on Assets (ROA): This ratio measures how efficiently an organization is using its assets to generate profits. The formula for the return on assets is:
ROA = Net Income / Total Assets
d. Return on Equity (ROE): This ratio measures the percentage return on an organization’s equity. The formula for the return on equity is:
ROE = Net Income / Shareholders’ Equity
- Efficiency Ratios:
a. Inventory Turnover: This ratio measures how quickly an organization is selling its inventory. The formula for the inventory turnover is:
Inventory Turnover = Cost of Goods Sold / Average Inventory
b. Accounts Receivable Turnover: This ratio measures how quickly an organization is collecting payments from its customers. The formula for the accounts receivable turnover is:
Accounts Receivable Turnover = Revenue / Average Accounts Receivable
c. Accounts Payable Turnover: This ratio measures how quickly an organization is paying its bills to suppliers. The formula for the accounts payable turnover is:
Accounts Payable Turnover = Cost of Goods Sold / Average Accounts Payable
- Solvency Ratios:
a. Debt-to-Equity Ratio: This ratio measures the amount of debt an organization has compared to its equity. The formula for the debt-to-equity ratio is:
Debt-to-Equity Ratio = Total Debt / Shareholders’ Equity
b. Interest Coverage Ratio: This ratio measures an organization’s ability to pay its interest expenses. The formula for the interest coverage ratio is:
Interest Coverage Ratio = Earnings Before Interest and Taxes (EBIT) / Interest Expenses
c. Debt Service Coverage Ratio: This ratio measures an organization’s ability to pay its debt obligations. The formula for the debt service coverage ratio is:
Debt Service Coverage Ratio = EBITDA / Total Debt Service
- Market Ratios:
a. Price-to-Earnings (P/E) Ratio: This ratio measures the price of a share of stock relative to its earnings per share. The formula for the P/E ratio is:
P/E Ratio = Price per Share / Earnings per Share
b. Market-to-Book Ratio: This ratio measures the market value of a share of stock relative to its book value. The formula for the market-to-book ratio is:
Market-to-Book Ratio = Market Value per Share / Book Value per Share
c. Dividend Yield: This ratio measures the percentage of return on investment from dividend payments. The


