The Directional Policy (GE-McKinsey) Matrix
The Directional Policy (GE-McKinsey) Matrix is a strategic planning tool used to evaluate a company’s business portfolio and determine which business units to invest in and which to divest. The matrix is a 9-cell grid that plots a company’s business units based on two dimensions:
- Industry attractiveness: This dimension measures the overall attractiveness of the industry in which a business unit operates, taking into account factors such as market size, growth rate, profitability, competition, and regulatory environment.
- Business unit strength: This dimension measures the strength of a business unit relative to its competitors, taking into account factors such as market share, brand equity, product quality, technology, and management capability.
The GE-McKinsey Matrix has three zones:
- Invest/Grow zone: This zone represents the business units that are attractive in terms of industry attractiveness and have strong business unit strength. These business units are prime candidates for investment and growth.
- Selectivity/earnings zone: This zone represents the business units that have moderate business unit strength but are in unattractive industries. These business units require careful consideration in terms of investment, and companies must decide whether to selectively invest in them or harvest their earnings.
- Harvest/Divest zone: This zone represents the business units that are weak in terms of business unit strength and operate in unattractive industries. These business units are not likely to generate significant profits and may need to be divested or harvested for cash.
The GE-McKinsey Matrix is a useful tool for companies to assess their business portfolio and determine which business units to invest in and which to divest. By using the matrix, companies can focus their resources on the most attractive business units and increase their chances of success.
Nine Cell of GE-McKinsey Matrix
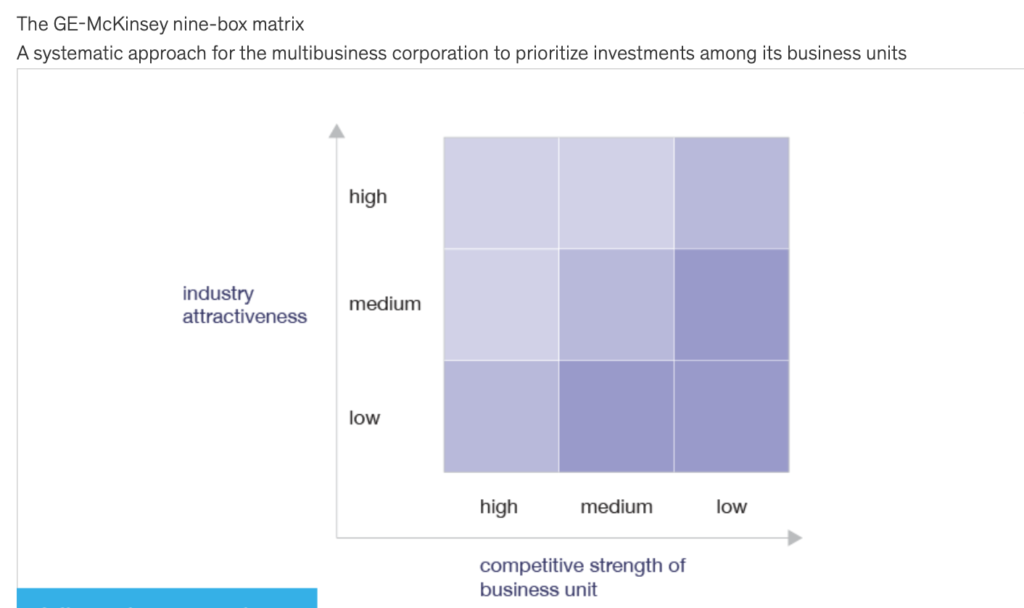
The vertical axis of the matrix represents industry attractiveness, while the horizontal axis represents business strength. Industry attractiveness is determined by factors such as market size, growth rate, profitability, and competition. Business strength is evaluated based on a company’s market share, financial resources, brand reputation, and other factors that determine its ability to compete in the market.
The nine cells of the matrix are as follows:
- Invest/Expand: High industry attractiveness and high business strength. This cell represents opportunities for investment and expansion.
- Grow/Build: Medium industry attractiveness and high business strength. This cell represents opportunities for growth and building.
- Selective Harvest: Low industry attractiveness and high business strength. This cell represents opportunities for selective harvesting of products or services that are no longer profitable.
- Harvest/Divest: Low industry attractiveness and medium business strength. This cell represents opportunities for harvesting cash flow from products or services that are no longer profitable or divesting them altogether.
- Maintain/Protect: Medium industry attractiveness and medium business strength. This cell represents opportunities for maintaining and protecting existing products or services.
- Grow/Invest: High industry attractiveness and low business strength. This cell represents opportunities for growth and investment, despite limited business strength.
- Selective Growth: Medium industry attractiveness and low business strength. This cell represents opportunities for selective growth in niche markets.
- Turnaround: Low industry attractiveness and low business strength. This cell represents opportunities for a turnaround strategy to improve business strength and industry attractiveness.
- Divest/Kill: Negative industry attractiveness and negative business strength. This cell represents products or services that should be divested or killed altogether.
The Directional Policy (GE-McKinsey) Matrix helps companies to identify the best strategic options for their business portfolio and allocate resources effectively to achieve their business objectives.